
Table of Contents
Popular this week
Jun 30, 2026
3 min read
See how your business stacks up with Industry benchmarks in Xero Analytics
You didn’t start your business to become a data analyst. But at some point, every owner hits the same wall: numbers are moving and you’re not sure if that’s good news or a warning sign.
Is your revenue growth actually good, or does it just feel that way? Are customers paying slower than they should be? Are costs rising because of something you can fix?
But is any of that a problem or is it industry standard? Without a point of comparison, you’re left guessing because that kind of market intel hasn’t been easily accessible.
Your industry benchmark, available in Xero
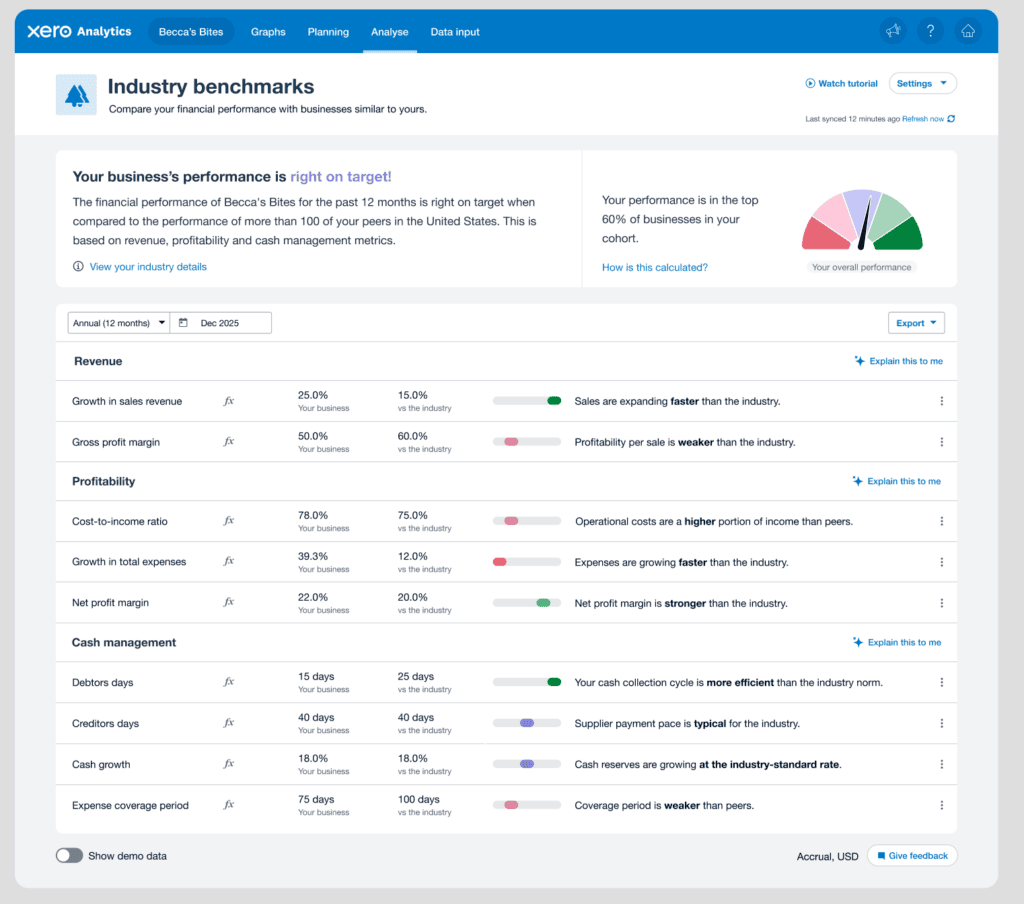
Industry benchmarking shows you how your business is performing compared to similar businesses, using real, anonymised data from the Xero platform. View your benchmark score for an instant comparison, or deep dive to compare key revenue, profitability and cash management metrics to see where you’re leading, lagging, or in line with peers.
Each metric comes with a clear explanation so you’re never left wondering what it actually means or how it’s calculated.
“I’ve been looking for industry comparison figures for years because it’s incredibly difficult to get that information. Benchmarks are fantastic because they provide that information.”
– Producer at FirstLookTV, UK
See the full picture of your performance
Today, many business owners often rely on gut feel, experience, or the occasional check-in with their advisor or business mentor to figure out if they’re on track. This is the reality for many when that market data hasn’t been accessible.
With Industry benchmarks, you can:
- Spot problems early: If your debtor days are high or your cost-to-income ratio is heading the wrong way, you can see and act on it before it becomes a cash flow headache.
- Validate big decisions: Thinking about a price increase? Hiring someone new? Check how your margins compare to your peers first. It may not make the decision for you, but it’ll give you visibility to inform decision-making.
- Stop guessing what ‘good’ looks like: Internal metrics only tell half the story. If your costs are rising and so are everyone else’s, that’s market pressure – and you can factor it into your planning.
Three ways to use benchmarking this month
- Check your debtor days: are customers taking significantly longer to pay than others in your industry? If yes, it might be time to tighten your credit terms or get invoice reminders working harder.
- Check your margins before changing your prices: before you move on pricing, look at where your gross and net margins sit relative to similar businesses. If you’re well below the benchmark, that’s a signal – there may be room to move on price, or your costs may need some attention first.
- Make it a monthly habit: with a benchmark score available in your existing plan type, you can do regular health checks to see if the changes you’re making are moving you in the right direction.
Your numbers tell a story; Industry benchmarks help you understand if it’s a good one. Log in to Xero to view your benchmark score.
Was this article helpful?
YesNo